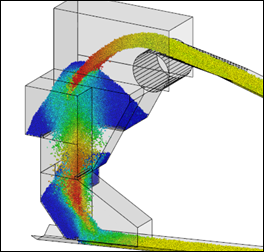
| Newton is a general purpose Discrete Element Method (DEM) simulation package used to quickly and accurately model three-dimensional behavior of granular flow. A variety of constitutive models have been included to model a wide range of material properties including wet, sticky, cohesive material. Material degradation, surface wear, impact damage, energy dissipation, and other fundamental parameters can easily be analyzed.
Newton is extremely flexible and can handle a wide variety of material properties and geometries including conveyor transfer chutes, apron feeders, chain feeders, bucket elevators, and more. It is developed and maintained by the engineering group at AC-Tek. |
 |
The proper modeling of granular flow using discontinuum mechanics is one of the most significant scientific advancements in the mining industry. The Discrete Element Method (DEM) is the name given to the solution process by which the macroscopic behavior of a system is determined by modeling its individual components.
In bulk solids handling, this involves the mathematical modeling of hundreds of thousands (often millions) of individual particles. Essentially, the software repeatedly solves Isaac Newton’s equations of motion for each particle over very small time intervals. With the tremendous advances in computing power over the past two decades, the DEM process is literally solved with a “brute force” approach. Advanced constitutive equations have now been implemented which allow accurate modeling of both cohesive and adhesive forces, allowing for the simulation of materials ranging from hard, dry lumps, to very sticky, and/or slimy material. |
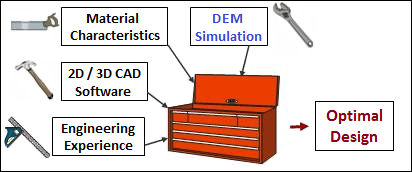
| However, the DEM method does not replace good engineering design and analysis; it should be applied and used no differently than any of the other “tools” an engineer has in their toolbox. It must be combined with good engineering knowledge, design experience, and a firm understanding of the characteristics of the material being conveyed.
The total flexibility of the DEM method is one of its most tantalizing qualities. By correctly modeling the small scale individual properties of a system, its global behavior may be analyzed and improved. |
 |
|---|
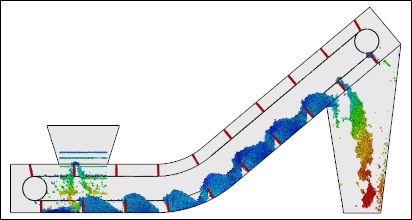
| The potential applications in the mining industry alone are huge, from conveyor belt transfer chutes, to apron feeders, to silos and augers. The DEM method has also been recognized in the manufacturing and pharmaceutical industries.
Click to see our full page of Newton Examples. AC-Tek is a leader in this rapidly-advancing technology. Our engineers and software developers have devoted an enormous amount of effort into developing the “Newton” DEM simulation software. Additionally, we have published several papers in this field, and have been involved with many projects using the DEM method. |
 |
|---|
Particle Creation & Material Sets |
|
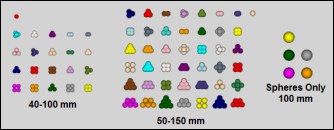
| The first step in DEM modeling is the creation of individual particles and groups of particles. The most basic DEM particle is a sphere. Spheres are used because they are very computationally efficient. Newton allows for any size and number of spherical particles.
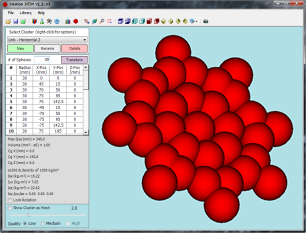
Far more powerful however, is Newton’s ability to group multiple spheres of various sizes together to form an irregular particle, called a “cluster.” Clusters may be generated using the built in generation tool, shown in the image at right, or by manually specifying the size and location of each sphere in the cluster. An unlimited number of cluster shapes can be created, and then scaled up or down to meet the desired material size distribution curves. Furthermore, cluster sets may be imported and exported to and from either a CAD file or an Excel spreadsheet, allowing the user maximum flexibility. AC-Tek’s Newton developers are continuously utilizing customer feedback to guide the addition of new cluster and material set features. |
 |
|---|---|
 |
 |
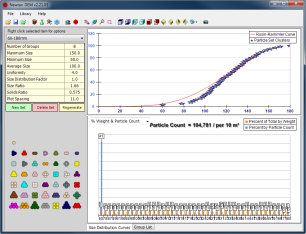 |
Once the fundamental cluster shapes have been created, the user can quickly and easily generate a size distribution curve based on the real material. Various distribution curves are available (Rosin & Rammler for example). A material set can be automatically generated from the known size distribution. Newton also contains several built-in material sets. The user can easily select one of these sets from a drop down list. Each set has been optimized in shape and size to be computationally efficient thereby resulting in fast simulation times.
Alternatively, the user can manually create a material set by specifying which clusters to use. Within a single material set, any cluster can be included any number of times. Each specific cluster (even different instances of the same cluster) can have a different size, and the user can designate the number clusters of that type per 10,000 clusters that will appear when the material is generated. |
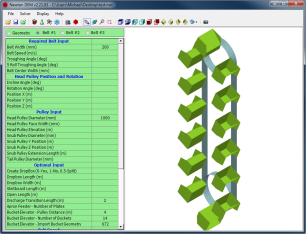
| Newton has been customized for the mining industry. Loading stations and conveyors can be automatically created by simply entering basic geometry information and the location of each belt.
Newton can automatically generate up to three independent feed conveyor belts for a single simulation. Each belt can be assigned custom start, acceleration, deceleration, stop, and restart times. This allows the user to simulate chute buildup during emergency stops, and then analyze how the transfer chute will respond when the conveyor restarts. These features allow the engineer to focus on the detail engineering (e.g. transfer chute design), rather than getting bogged down creating belt feed points and other required DEM details. |
 |
Triangle and Layer Movement |
||
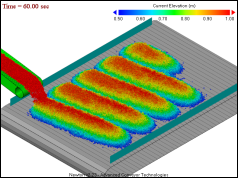 |
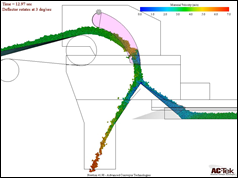
Newton also allows boundary surfaces to have movement, such as linear or rotational motion. This movement is necessary for simulating things like gates, moving trolleys, truck dumps, apron feeders (shown at left), and rotating hoods or spoons (shown at right) for transfer chute design.
Newton can even combine these movements to simulate an object that is moving and rotating simultaneously, such as a dragline bucket. |
 |
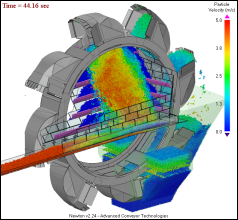 |
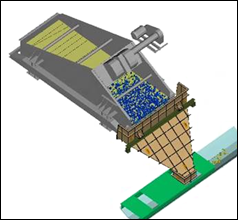
Newton has been used to simulate bucket wheels (shown at left) as well as vibrating equipment (shown at right).
To simulate vibrating equipment, Newton can give linear or rotational (circular or elliptic) cyclic motion to boundary surfaces. The user need only specify the cycle time, and linear distance or rotation radius for the cyclic motion. |
 |
| One of Newton’s newer features is custom geometry movement profiles. Users can create movement profiles for each layer in the simulation. Using a CSV file, simply specify the time at which each movement begins, as well as the X, Y, and Z translation and/or rotation rate. The movement profile can contain up to 100 different movements.
The animation shown at right demonstrates this ability using a bucket. Particles are dumped into a pile and the bucket is dragged through the pile. Then the bucket lifts out of the box, moves foward a few meters, and dumps the material. Click to see more Newton animation examples. |
Material Generation for Simulation |
|
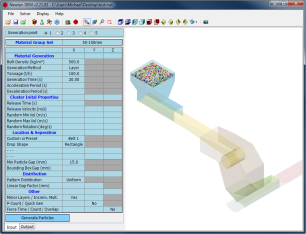 |
Once the geometry and material sets have been entered, the two must be combined together. The image to the left shows the generation input parameters window. The user need only specify the material set, belt tonnage, and generation time.
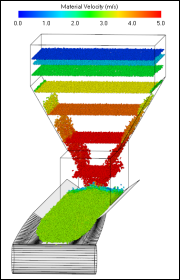
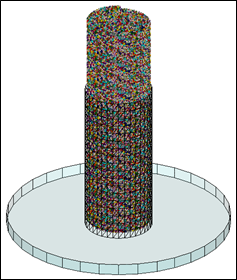
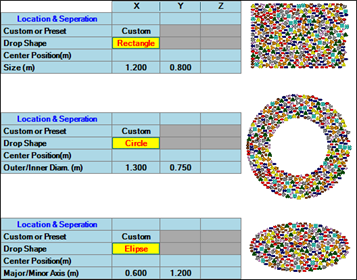
Newton allows for up to five different material generation locations. Each location can have different material sets and tonnages. Additionally, material sets may be released in layers, or as blocks of material. The figures below show different material generation methods: The left figure shows material generated in layers, and the middle figure shows material generated as a block. In addition to the generation method, the user can also choose the drop shape for the material. Currently, Newton can generate material as rectangles, circles, ellipses, and annuli. The rightmost figure below shows three drop shapes. |
 |
|  |
 |
When modeling any complex problem on a computer, a firm understanding of the real world parameters is necessary to accurately represent and predict the system behavior. In many applications the material properties can vary significantly over a given time frame (such as winter versus summer conditions).
At first this may seem to be a major obstacle when trying to predict material behavior. However, this is perhaps the greatest strength of computer modeling. For any given geometry, a wide range of material properties (friction coefficients, moisture content, cohesive properties, etc.) can be modeled and analyzed. Various size distributions, and even completely different material types can be simulated. Trouble areas can be spotted, and the design can be modified before ever leaving the drafting table. This is major advantage over the historical practice of trial and error. |
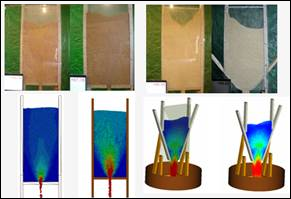
| The figure at right shows a snapshot from a standard test that is performed for all predefined material sets in Newton. As the middle (low friction, no cohesion) and right (high friction, high cohesion) images show, the input parameters can create a variety of material sizes and consistencies. |  |
Running the Simulation |
||
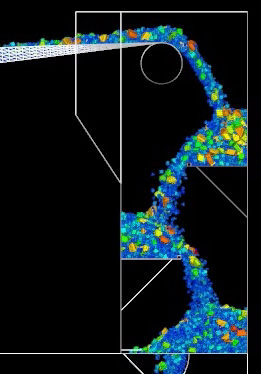 |
Once the simulation parameters have been defined, it’s time for the computer go to work. DEM simulations require anywhere from 10 minutes, to several days, or even weeks to solve a problem. Advances in industrial computing power are continually lowering the time required for a simulation.
The number and size of particles in a given simulation are the primary factors that determine simulation run time. As a rule of thumb, a typical workstation computer is capable of solving a reasonable flow simulation in 12-48 hours. By default, Newton saves a special restart file after every 2 seconds of simulation. This file contains all simulation data up to that point, so if there is a power failure or the simulation needs to be stopped for any reason, only a few minutes (or maybe a few hours) of computation time is lost. The simulation can be restarted with just a few button clicks. |
 |
 |
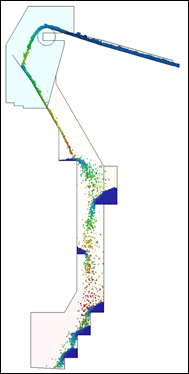
The image at left shows a simulation running with eight separate threads. The particles are colored according to thread, and the black particles in between the color groups are the cleanup thread (these particles are updated last at each time step). |
 |
 |
| Visualization of the simulation results is a critical component of DEM. The engineer must be able to understand the material flow.
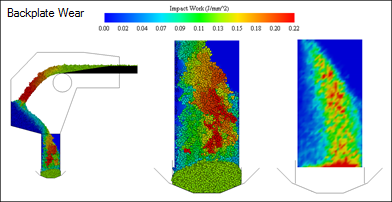
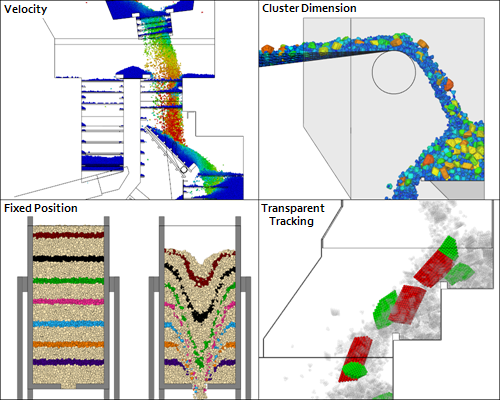
Newton has incorporated multiple tools so that the geometry and material flow can be viewed in diverse ways. This includes coloring the particles uniformly, or by cluster type, velocity, fixed Z-elevation, instantaneous elevation, and much more. Specific cluster types in the flow can even be highlighted while making all other particles transparent, allowing the user to track a specific type of cluster through the simulation. The image at right shows four different methods for coloring particles in Newton. Boundary geometries can be represented as solid, transparent, or wireframe surfaces, or can be colored according to wear and degradation from particle impact and abrasion. |
 |
|
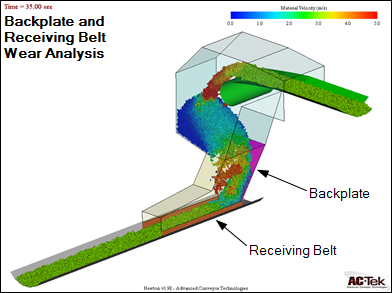
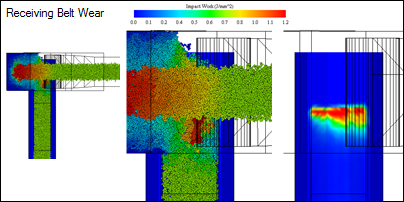
The animation shown at left shows many of Newton’s post-processing functions. Several different particle and boundary surface viewing methods are shown, as well as an impact wear analysis on the back wall of the chute.
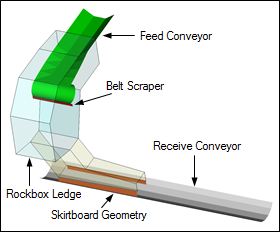
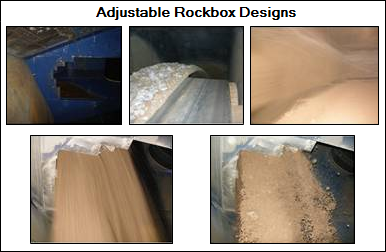
The use of a rockbox (i.e. the ledge onto which the material falls) helps prevent degradation of the chute surfaces by having the material impact and pile up upon itself rather than the chute surface. The animation’s impact analysis shows how the material will wear the backplate of the chute as it slides onto the receiving belt. The material falls slightly heavier on the right side of the belt, indicating that this chute design needs further optimization so that the material centers properly. Click to see more Newton animation examples, including apron feeders, augers, silos, and more. |
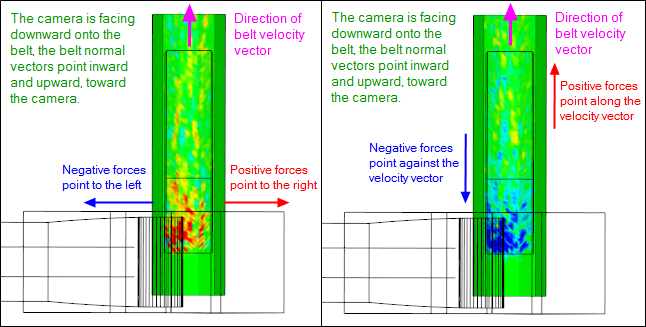
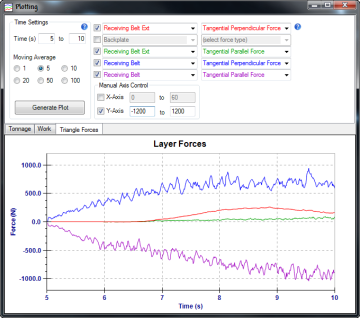
| Boundary surface forces can also be recorded. The graphic at right shows the parallel and perpendicular forces applied to a receiving belt. In this case there is an off-centering force on the belt, as shown by the non-zero perpendicular force. This could potentially push the belt off-track if not corrected. The figure below shows the parallel and perpendicular forces applied to the belt on a per-triangle basis. This helps the user identify where the off-centering forces are being applied.
Sensitivity studies are also possible and help the designer understand the how various changes in the design will affect the material flow other design parameters. The use of DEM modeling allows a design to be optimized well before it is sent to the manufacture for fabrication or installed on site. This results in substantially lower project costs and fewer post-manufacture redesigns. |
 |

